
What does the tool do?
The tool helps find groups where an AI system or algorithm performs differently, which could indicate unfair treatment. This type of monitoring is called anomaly detection. It detects deviations using a technique called clustering, which groups similar data points together (in clusters). The tool doesn’t need information like gender, nationality, or ethnicity to find deviations. Instead, it uses an bias variable to measure deviations in the performace of the system, which you can choose based on your data.
What results does it give?
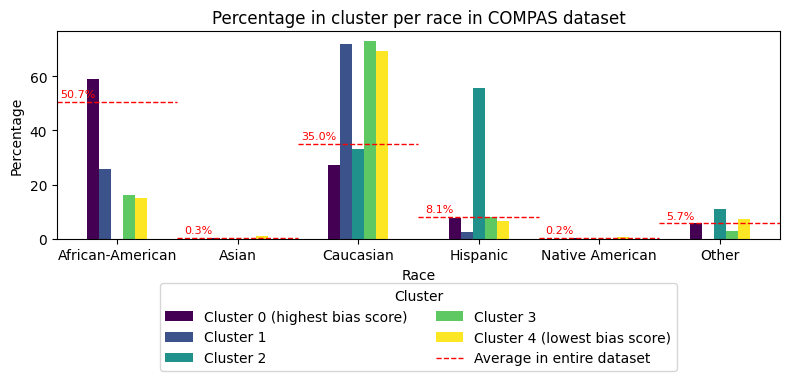
The tool finds groups (clusters) where performance of the algorithmic system is significantly deviating. It highlights the group with the worst bias variables and creates a report called a bias analysis report, which you can download as a PDF. You can also download all the identified groups (clusters) in a .json file. Additionally, the tool provides visual summaries of the results, helping experts dive deeper into the identified deviations. An example can be found below.
What kind of data does the tool work with?
The tool works with data in a table format, consisting solely of numbers or categories. You need to pick one column in the data to use as the bias variable. This column should have numbers only, and you’ll specify whether a higher or lower number is better. For example, if you’re looking at error rates, lower numbers are better. For accuracy, higher numbers are better. The tool also comes with a demo dataset you can use by clicking “Demo dataset”.
Example of numerical dataset:
| Age | Income | ... | Number of cars | Selected for investigation |
|---|---|---|---|---|
| 35 | 55.000 | ... | 1 | 1 |
| 40 | 45.000 | ... | 0 | 0 |
| ... | ... | ... | ... | ... |
| 20 | 30.000 | ... | 0 | 0 |
Is my data safe?
Yes! Your data stay on your computer and never leave your organization’s environment. The tool runs directly in your browser, using your local device’s computing power to analyze the data. This setup, called ’local-only’, ensures no data are sent to cloud providers or third parties – not even to Algorithm Audit. More information about this local-only architecture can be found below. Instructions for hosting local-only tools within your organization are available on Github.
Try the tool below ⬇️
Which steps does the tool undertake?
The unsupervised bias detection tool performs a series of steps:
Required preparations by the user:
Step 1. Data: the user shoulds prepare the following aspects relating to the processed data:
- Dataset: The data must be provided in a tabular format. Any missing values should be removed or replaced.
- Type of data: All columns, except the bias variable column, should have uniform data types, e.g., either all numerical or all categorical. The user selects whether numerical of categorical data are processed.
- Bias variable: A column should be selected from the dataset to serve as the
bias variable, which needs to be categorical. In step 4, clustering will be performed based on these categorical values. Examples include metrics such as “being classified as high risk”, “error rate” or “selected for an investigation”.
Step 2. Hyperparameters: the user shoulds set the following hyperparameters:
- Iterations: How often the data are allowed to be split in smaller clusters, by default 3 iterations are selected.
- Minimal cluster size: How many datapoints the identified clusters may contain, by deafault set to 1% of the number of rows in the attached dataset. More guidance on well-informed choice of the minimal cluster size can be found in section 3.3 of our scientific paper.
- Bias variable interpretation: How the bias variable should be interpreted. For instance, when error rate or misclassifications are chosen as the bias variable, a lower value is preferred, as the goal is to minimize errors. Conversely, when accuracy or precision is selected as the bias variable, a higher value is preferred, reflecting the aim to maximize performance.
Performed by the tool:
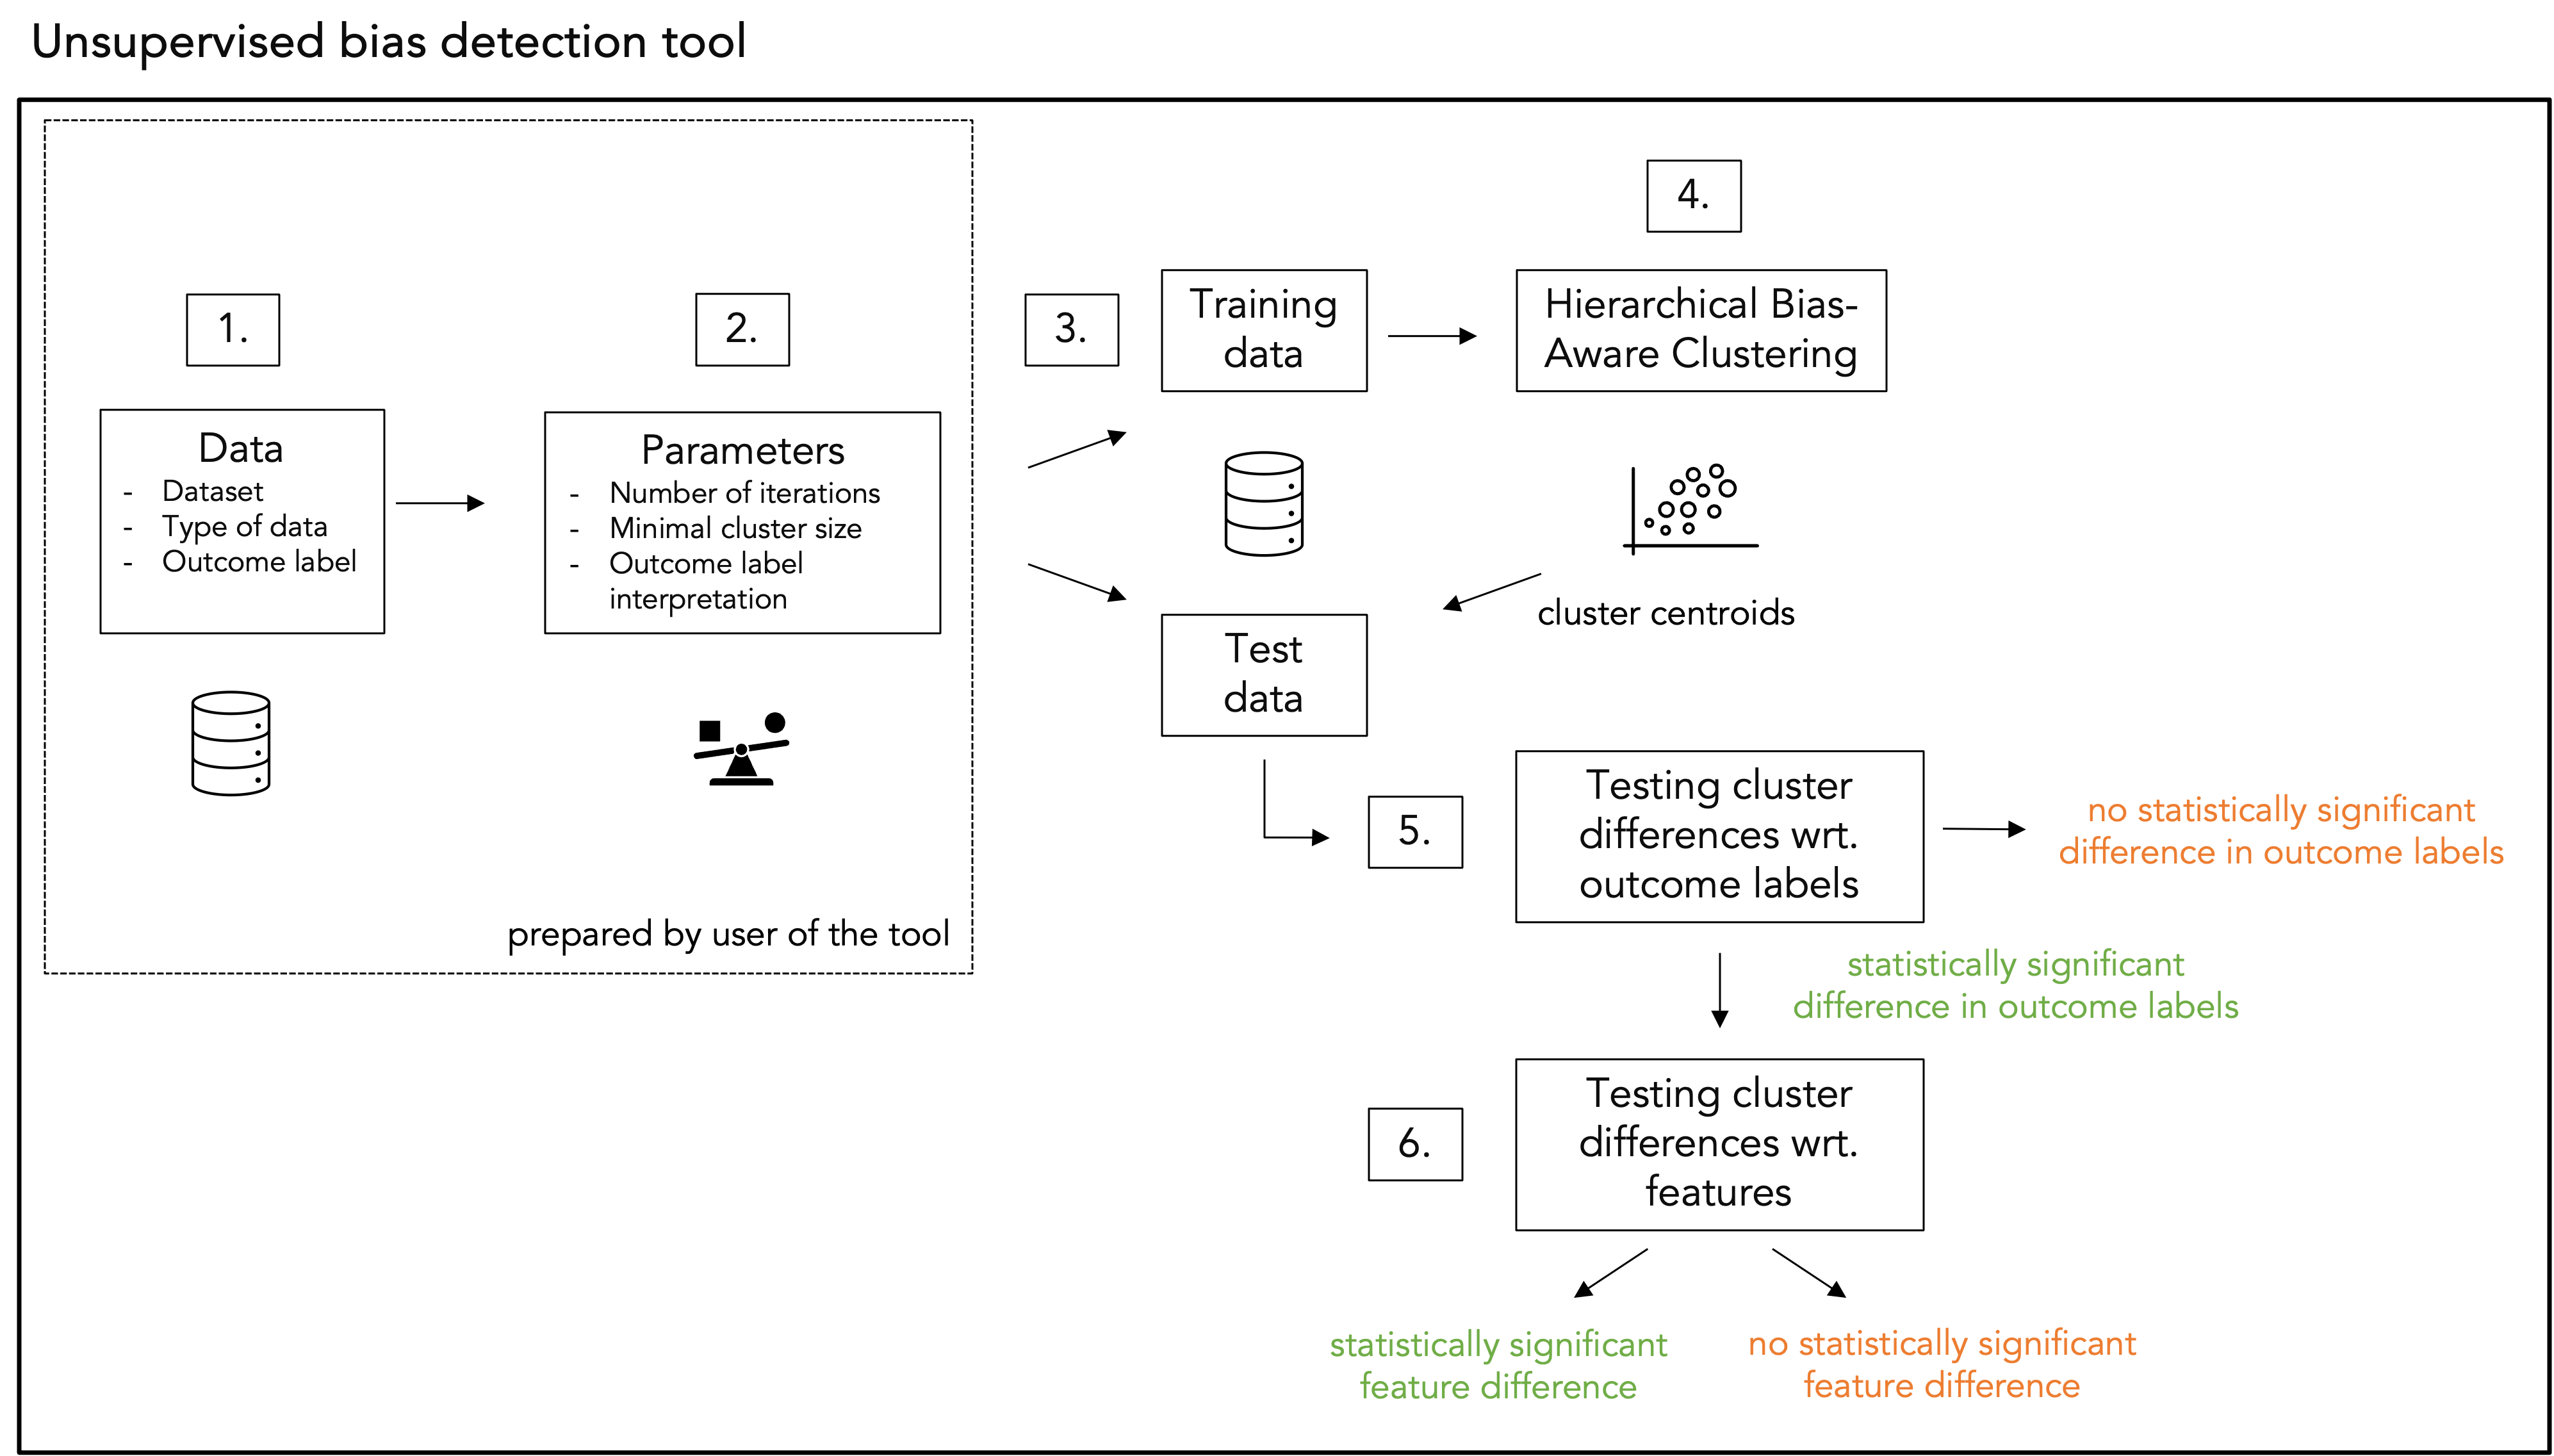
Step 3. Train-test data: The dataset is divided into train and test subset, following a 80-20 ratio.
Step 4. Hierarchical Bias-Aware Clustering (HBAC): The HBAC algorithm (detailed below) is applied to the train dataset. The centroids of the resulting clusters are saved and later used to assign cluster labels to data points in the test dataset.
Step 5. Testing cluster differences wrt. bias variable: Statistical hypothesis testing is performed to evaluate whether the bias variable differ significantly in the most deviating cluster compared to the rest of the dataset. A one-sided Z-test is used to compare the means of the bias variable by testing the following hypothesis:
H_0: no difference in bias variable between the most deviating cluster and the rest of the dataset
H_A: difference in bias variable between the most deviating cluster and the rest of the dataset.
Step 6. Testing cluster differences wrt. features: If H_0 is rejected and H_1 is accepted, i.e., a statistically significant difference in bias variable between the most deviating cluster and the rest of the dataset occurs, feature diffences between the most deviating cluster and the rest of the dataset are examined. For this, also statistical hypothesis testing is used, namely a t-test in case numercial data and Pearson’s 𝜒2-test in case categorical data are processed. For multiple hypothesis testing, Bonferonni correction is applied. Further details can be found in section 3.4 of our scientific paper.
A schematic overview of the above steps is depicted below.
How does the clustering algorithm work?
The Hierarchical Bias-Aware Clustering (HBAC) algorithm identifies clusters in the provided dataset based on a user-defined bias variable. The objective is to find clusters with low variation in the bias variable within each cluster. Variation in the bias variable between clusters should be high. HBAC iteratively finds clusters in the data using k-means (for numerical data) or k-modes clustering (for categorical data). For the initial split, HBAC takes the full dataset and splits it in two clusters. Cluster C – with the highest standard deviation of the bias variable – is selected. Then, cluster C is divided into two candidate clusters C' and C''’. If the average bias variable in either candidate cluster exceed the the average bias variable in C, the candidate cluster with highest bias variable is selected as a new cluster. This process repeats until the maximum number of iterations (max_iterations) is reached or the resulting cluster fails to meet the minimum size requirement (n_min). The pseudo-code of the HBAC algorithm is provided below.
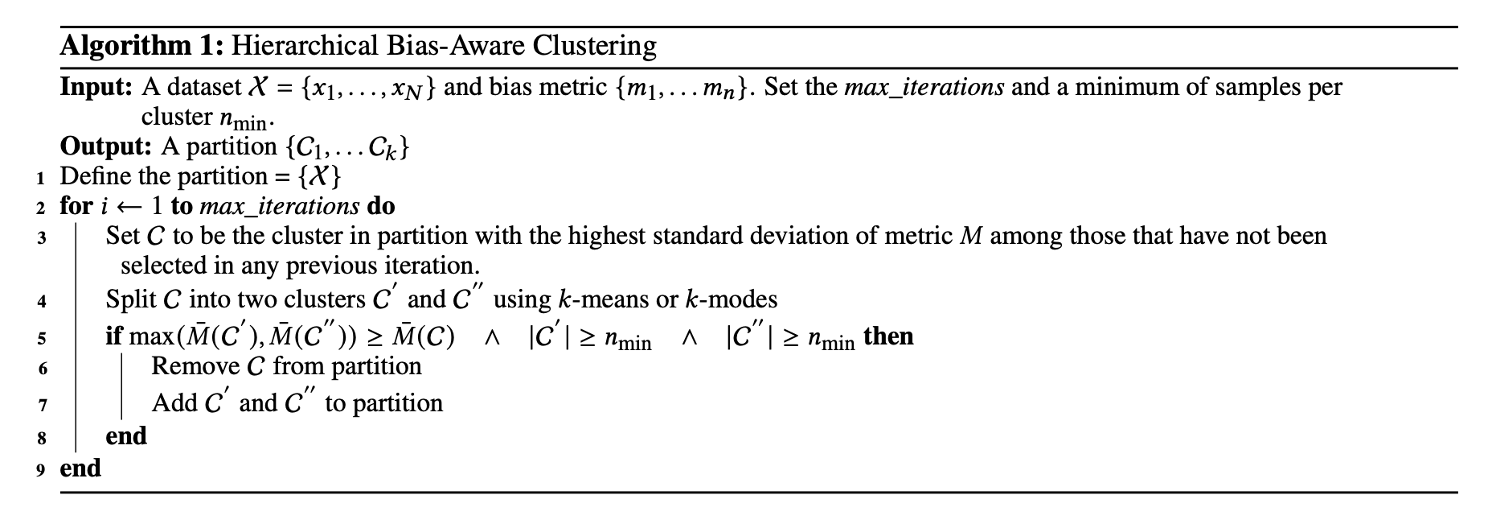
The HBAC-algorithm is introduced by Misztal-Radecka and Indurkya in a scientific article as published in Information Processing and Management in 2021. Our implementation of the HBAC-algorithm advances this implementation by proposing additional methodological checks to distinguish real singals from noise, such as sample splitting, statistical hypothesis testing and measuring cluster stability. Algorithm Audit’s implementation of the algorithm can be found in the unsupervised-bias-detection pip package.
How should the results of the tool be interpreted?
The HBAC algorithm maximizes the difference in bias variable between clusters. To prevent incorrect conclusions that there are unwanted deviations in the decision-making process under review when there truly is none, we: 1) split the dataset in training and test data; and 2) test hypotheses. If a statistically significant deviation is detected, the outcome of the tool serves as a starting point for human experts to assess the identified deviations in the decision-making processes.
Web app – Unsupervised bias detection tool
- The source code of unsupervised bias detection using the HBAC algorithm is available on Github and as a pip package:
pip install unsupervised-bias-detection. - The architecture to run local-only web apps is also available on Github.
The unsupervised bias detection tool has been applied in practice to audit a Dutch public sector risk profiling algorithm. Our team documented this case in a scientific paper. The tool identified proxies for students with a non-European migration background in a risk profiling algorithm. Specifically the most deviating cluster contains above average students following vocational education and has higher-than-average students living far away from their parent(s)’ address, which turned out to be correlate significantly with students with a non-European migration background. Deviations in the control process could therefore also have been found if aggregation statistics on the origin of students had not been available. The results are also described in Appendix A of the below report. This report was sent to Dutch parliament on 22-05-2024.
What is local-only?
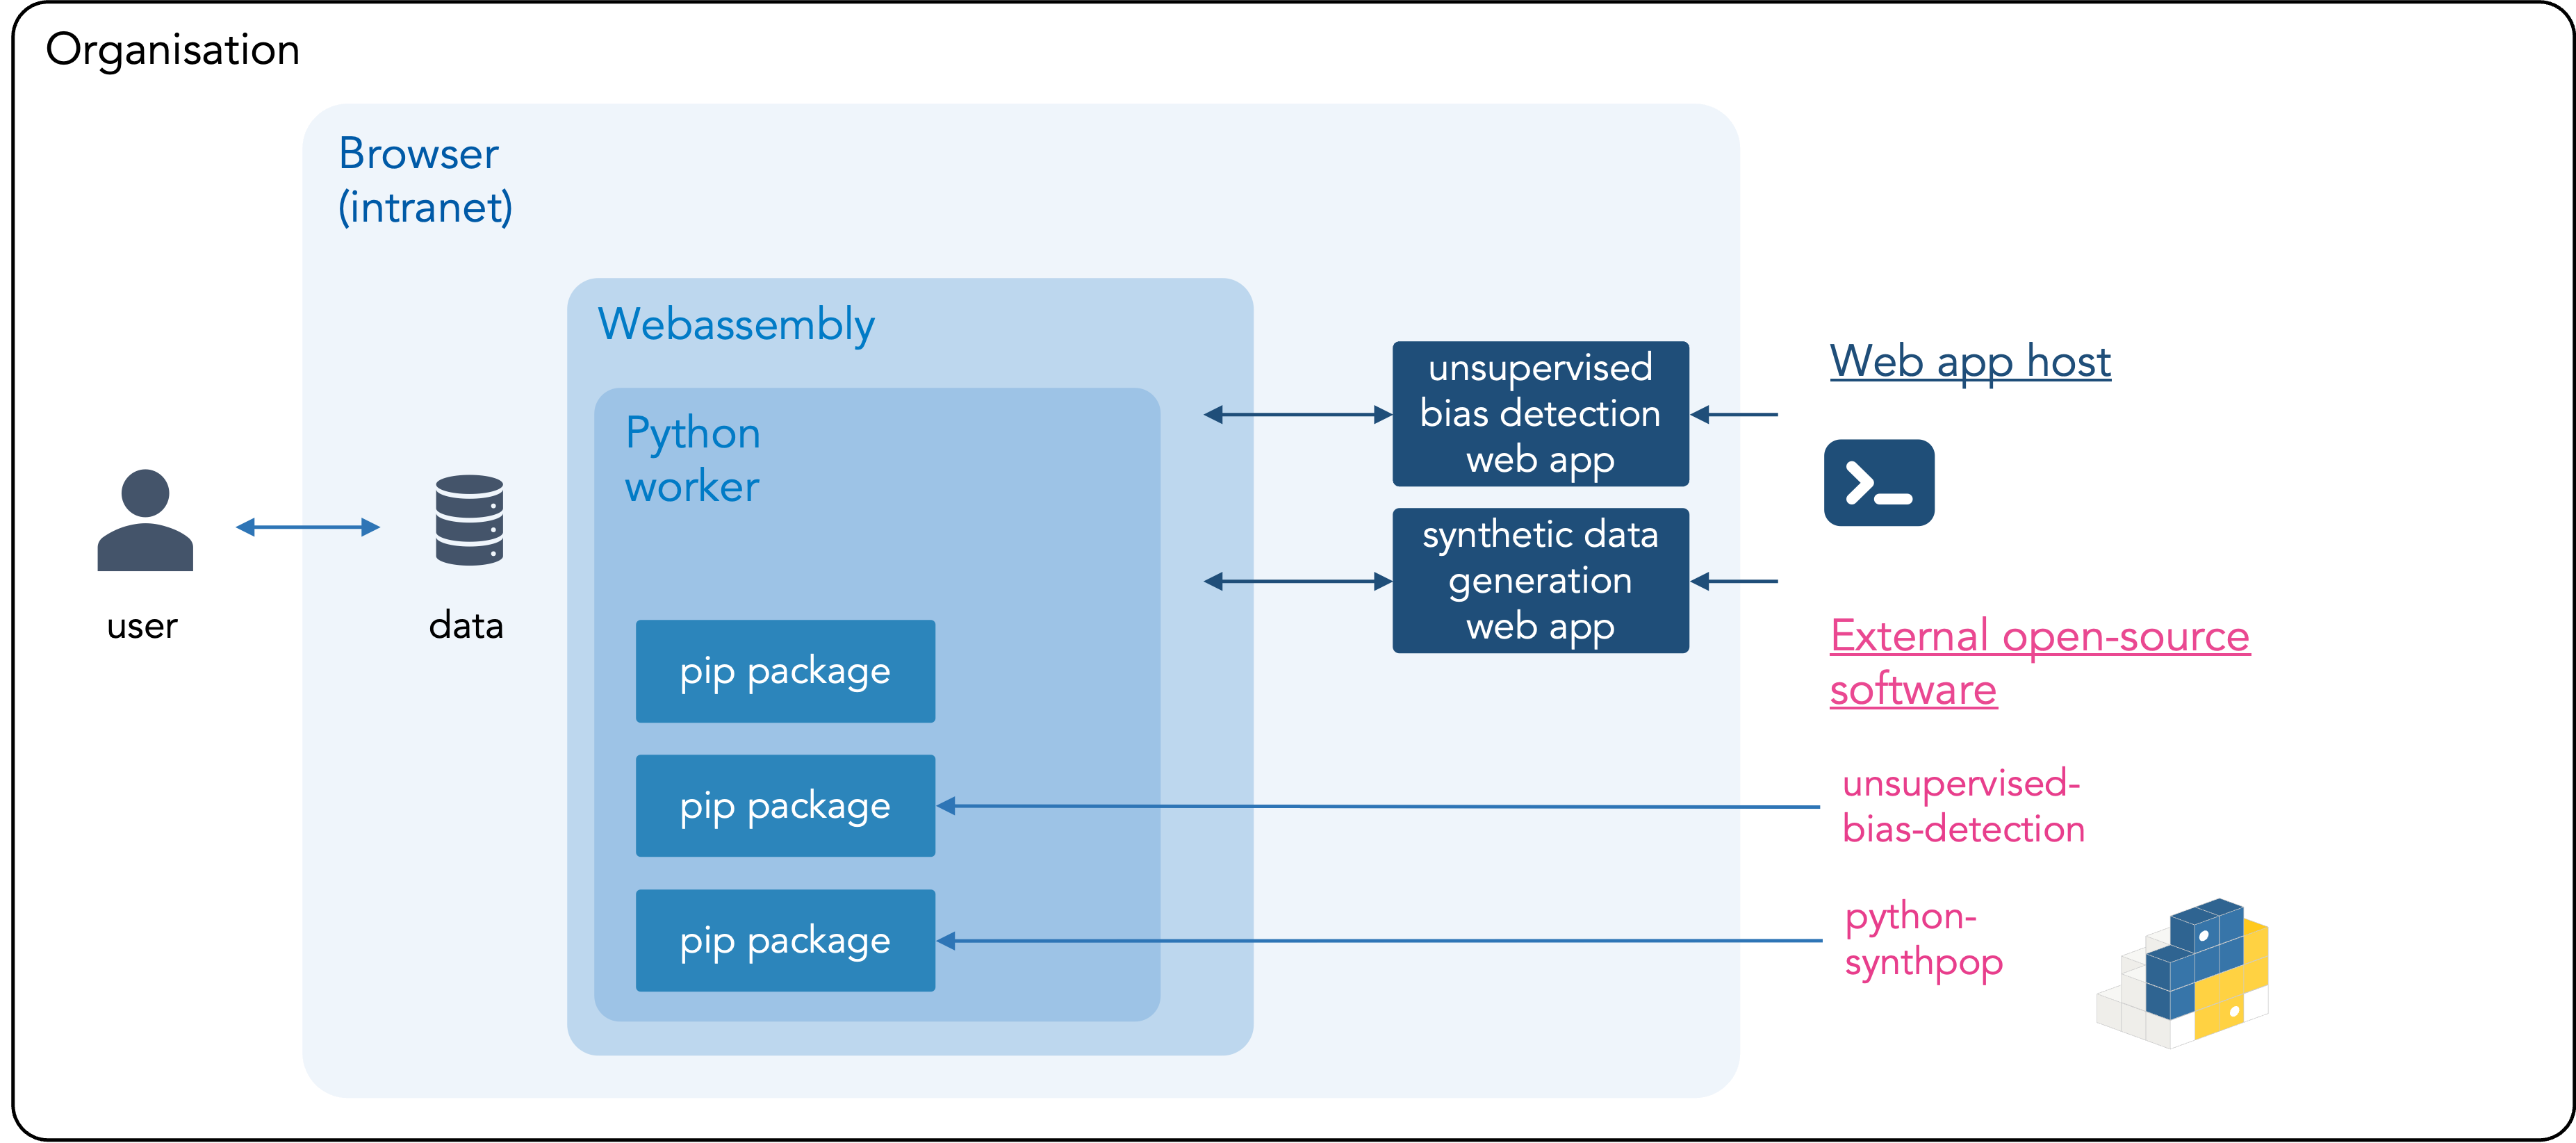
Local-only computing is the opposite of cloud computing: data are not uploaded to third-parties, such as a cloud providers, but are processed by your own computer. The data attached to the tool therefore don’t leave your computer or the environment of your organization. The tool is privacy-friendly because the data can be processed within the mandate of your organisation and doesn’t need to be shared with new parties. The unsupervised bias detection tool can also be hosted locally within your organization. Instructions, including the source code or the web app, can be found on Github.
Overview of local-only architecture
Explainer – Local-only tools for AI validation
This tool is developed with support of public and philanthropic organisations.

Innovation grant Dutch Ministry of the Interior
Description
In partnership with the Dutch Executive Agency for Education and the Dutch Ministry of the Interior, Algorithm Audit has been developing and testing this tool from July 2024 to July 2025, supported by an Innovation grant from the annual competition hosted by the Dutch Ministry of the Interior. Project progress was shared at a community gathering on 13-02-2025.


SIDN Fund
Description
In 2024, the SIDN Fund supported Algorithm Audit to develop a first demo of the unsupervised bias detection tool.
This tool has received awards and is acknowledged by various stakeholders, including civil society organisations, industry representatives and academic outlets.
IASEAI’26 presentation
Description
The scientific paper of the tool was presented during the the International Association for Safe and Ethical Artificial Intelligence (IASEAI’26).
OECD Catalogue of Tools & Metrics for Trustworthy AI
Description
The unsupervised bias detection tool is part of OECD’s Catalogue of Tools & Metrics for Trustworthy AI.

Finalist Stanford’s AI Audit Challenge 2023
Description
Under the name Joint Fairness Assessment Method (JFAM) the unsupervised bias detection tool has been selected as a finalist in Stanford’s AI Audit Competition 2023.
Key take-aways about unsupervised bias detection tool:
- Quantitative-qualitative research method: Data-driven bias testing combined with the balanced and context-sensitive judgment of human experts;
- Unsupervised bias detection: No data needed on protected attributes, e.g., gender or ethnicity (unsupervised learning);
- Anolamy detection: Scalable method based on statistical analysis;
- Detects complex bias: Identifies unfairly treated groups characterized by mixture of features, detects intersectional bias;
- Model-agnostic: Works for all algorithms and AI systems;
- Open-source and not-for-profit: User friendly and free to use for the entire AI auditing community.
Team

Floris Holstege
PhD-candidate Machine Learning, University of Amsterdam

Joel Persson PhD
Research Scientist, Spotify

Kirtan Padh
PhD-candidate Causal Inference and Machine Learning, TU München

Krsto Proroković
Freelance software developer and AI researcher

Mackenzie Jorgensen PhD
Postdoctoral Research Fellow, Northumbria University

Jurriaan Parie
Director, Algorithm Audit