What is synthetic data?
Synthetic data is artificial data mimicking the original dataset’s statistical characteristics without sharing personal data.
What data can be processed?
The tool processes all data in table format. The type of data (numerical, categorical, time, etc.) and missing values are automatically detected. The user has several options for how missing values can be processed. More info about how missing values can be treated is provided in the tool.
What does the tool return?
The tool generates synthetic data. An evaluation report of the generated data, including various evaluation metrics, is automatically created and can be downloaded as a pdf. The synthetic data can be downloaded in .csv and .json format.
What synthetic data generation methods are supported?
Users can currently choose two methods for generating synthetic data:
- Classification And Regression Trees (CART); and
- Gaussian Copula (GC).
By default, CART is used. CART generally produces higher quality synthetic data, but might not work well on datasets with categorical variables with 20+ categories. GC is recommended in those cases. The tool contains a demo data explaing how data are processed. Use the “Demo dataset” in the web app.
Is my data safe?
Yes! Your data stay on your computer and don’t leave your organization’s environment. The tool runs directly in your browser, using your local device’s computing power to analyze the data. This setup, called ’local-only’, ensures no data are sent to cloud providers or third parties. More information about this local-only architecture can be found below. Instructions for hosting local-only tools within your organization are available on Github.
Try the tool below ⬇️
The synthetic data generation tool performs a series of steps:
Required preparations by the user:
The user shoulds prepare the following aspects to synthesize data:
- Dataset: Only categorical, numerical, or time data can be processed. Datasets may contain a maximum of 8 columns, must have a header with column names and do not require an index column.
- Method: By default, the CART method is used to generate synthetic data. CART generally produces higher quality synthetic data, but might not work well on datasets with categorical variables with 20+ categories. Use Gaussian Copula in those cases.
- Number of synthetic data points: Number of synthetic data points to be generated by the tool. Due to computational contstraints of browser-based synthetic data generation, the maximum is set to 5.000.
Performed by the tool
The following steps are performed by the tool:
Step 1. Data types detection:
The tool detects the type of data for each column of the attached dataset (numerical, categorical or datetime).
Step 2. Handling missing data:
- Missing at Random (MAR): The probability of data being missing is related to the observed data but not the missing data itself. The missingness can be predicted by other variables in the dataset. Example: Students’ test scores are missing, but the missingness is related to their attendance records. For this scenrario missing data is imputed.
- Missing Not at Random (MNAR): The probability of data being missing is related to the missing data itself. There is a systematic pattern to the missingness that is related to the unobserved data. Example: Patients with more severe symptoms are less likely to report their symptoms, leading to missing data that is related to the severity of the symptoms. For this scenrario missing data is imputed.
- Missing Completely at Random (MCAR): The probability of data being missing is completely independent of both observed and unobserved data. There is no systematic pattern to the missingness. Example: A survey respondent accidentally skips a question due to a printing error. In this scenario missing data is removed.
More information on the concepts MCAR, MAR en MNAR can be found in the book cby prof. Stef van Buuren, Utrecht University.
Step [unnumbered] Preprocessing:
Transforms all data into numerical format using LabelEncoder for less than 10 unique value per categorical column, OneHotEncoder for less than 50 unique value per categorical column and FrequencyEncoding for other cases. StandardScaler is used for numerical data.
Step 3. Synthesize method
- CART: The CART (Classification and Regression Trees) method generates synthetic data by learning patterns from real data through a decision tree that splits data into homogeneous groups based on feature values. It predicts averages for numerical data and assigns the most common category for categorical data, using these predictions to create new synthetic points.
- Gaussian Copula: Gaussian Copula works in two main steps: 1. The real data is transformed into a uniform distribution. Correlations between variables are modeled using a multivariate normal distribution (the Gaussian copula); and 2. Synthetic data is created by sampling from this Gaussian copula and transforming the samples back to the original data distributions.
Step [unnumbered] Postprocessing:
Encoded data are transformed back to it’s original format.
Step 4. Evaluation:
The generated synthetic data are evaluated in various ways.
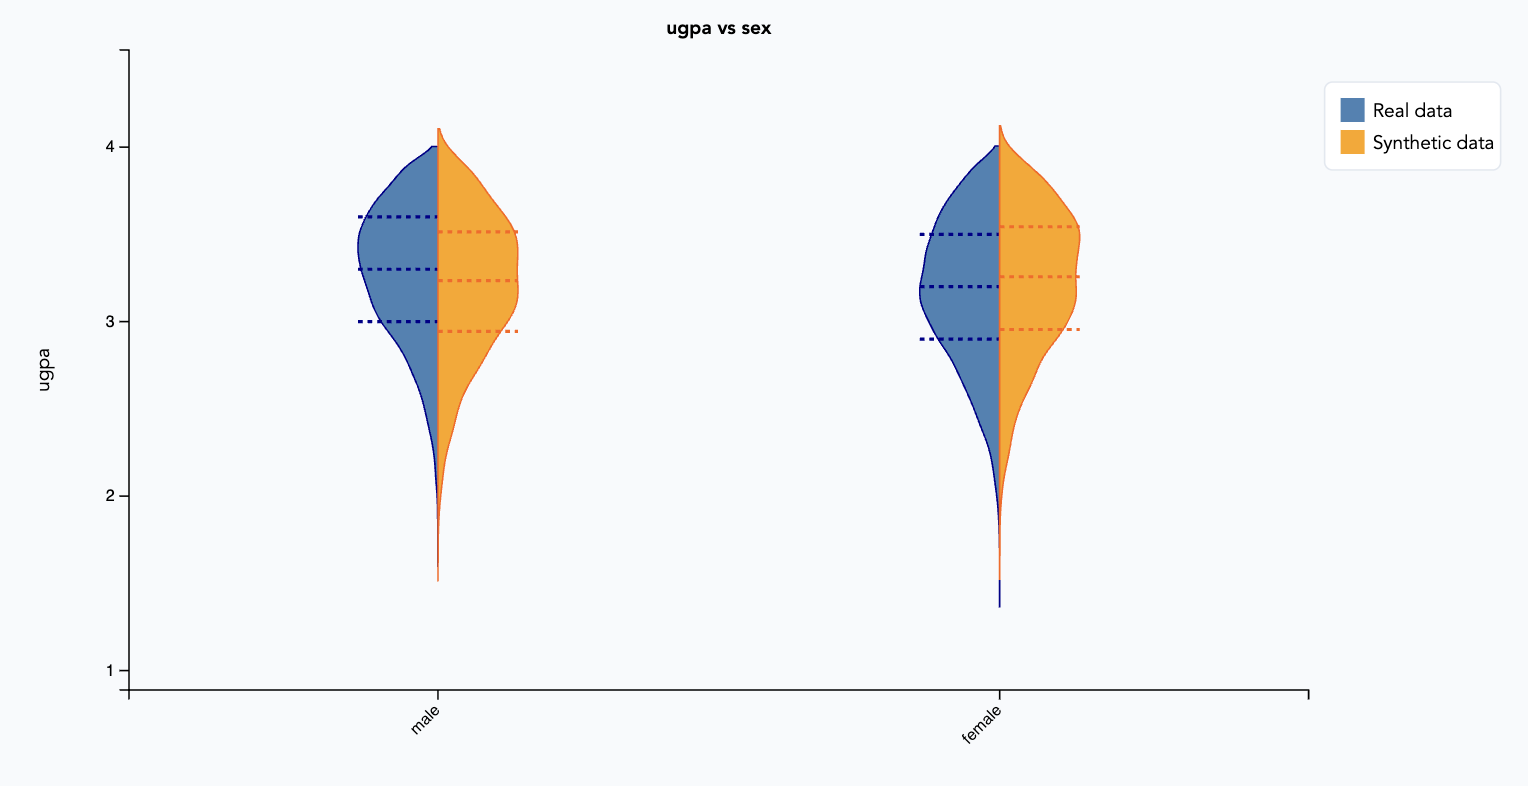
Step 4.1 Visualization:
Univariate and bivariate plots are created to compare the generated synthetic data with the real data. For comparing categorical variables, bar charts are plotted. For comparing a numerical and a categorical variables, a violin plot is created. For comparing numercial variables, a LOESS plot is shown. For all plots holds: the synthetic data is of high quality when the shape of the distributions in the synthetic data equal the distributions in the real data.
Step 4.2 Diagnostic report:
For each column, diagnostic results are computed for the quality of the generated synthetic data. The computed metrics depend on the type of data.
Diagnostic results:
For numerical (or datetime) columns the following metrics are computed:
- Missing value similarity: Compares whether the synthetic data has the same proportion of missing values as the real data for a given column;
- Range coverage: Measures whether a synthetic column covers the full range of values that are present in a real column;
- Boundary adherence: Measures whether a synthetic column respects the minimum and maximum values of the real column. It returns the percentage of synthetic rows that adhere to the real boundaries;
- Statistic similarity: Measures the similarity between real column and a synthetic column by comparing the mean, standard deviation and median;
- Kolmogorov–Smirnov (KS) complement: Measures the maximum difference between the cumulative distribution functions (CDFs) of numerical columns in the synthetic and real dataset.
For categorical columns the following metrics are computed:
- Missing value similarity: Compares whether the synthetic data has the same proportion of missing values as the real data for a given column;
- Category coverage: Measures whether a synthetic column covers all the possible categories that are present in a real column;
- Category adherence: Measures whether a synthetic column adheres to the same category values as the real data;
- Total variation (TV) complement: Measures the maximum difference between the cumulative distribution functions (CDFs) of categorical columns in the synthetic and real dataset.
💯 For high-quality synthetic data, all values should be close to 1.0, but at least higher than 0.85.
Correlation matrix:
The one-to-one correlations between variables in the synthetic and real data are calculated, indicating the strength and direction of their linear relationships. The correlation matrix of the generated synthetic and real data should roughly display the same patterns.
Efficacy metrics:
cComparing real and synthetic datasets for downstream predictive tasks, such as regression and classification. The idea is to train a predictive model on synthetic data and evaluate its performance on real data.
For regression (when the target variable is numerical), the following metrics are computed:
- Mean squared error (MSE): average squared difference between predicted and actual values, quantifying the accuracy of a model’s predictions by penalizing larger errors more heavily;
- Mean absolute error (MAE): average magnitude of the errors between predicted and actual values, providing a straightforward assessment of model accuracy without emphasizing large errors;
- R² score: quantifies how well a model’s predictions match the actual data by measuring the proportion of variance in the target variable explained by the model.
For classification (when the target variable is categorical), the following metrics are computed:
- Accuracy score: measures the proportion of correctly predicted instances out of the total instances, providing an overall assessment of a model’s performance in classification tasks;
- Weighted F1 score: harmonic mean of precision and recall, calculated for each class and weighted by the class’s support (number of true instances), providing a balanced performance measure for imbalanced datasets.
Privacy metrics:
Computing the disclosure protection metric for synthetic data. This metric measures the proportion of synthetic records that are too similar (within a defined threshold) to real records, posing a disclosure risk.
Step 5. Download:
The generated synthetic data can de downloaded as csv and as json file. Evaluation of the synthetic data according to the above metrics can be downloaded as a evaluation report in pdf.
Documentation
More documentation about the tool and underlying SDG methods can be found on Github.
Synthetic data generation tool
- The source code of the synthetic data generation methods are available on Github and as a pip package:
pip install python-synthpop. - The architecture to run local-only web apps is also available on Github.

For two reasons, the use of synthetic data has long been hindered:
- Privacy risks – Concerns, particularly among legal professionals, existed about the risks of personal data being exposed when sharing synthetic data. Research and practical examples have demonstrated that these risks can be mitigated. See the attached memo below for more background information on the legal aspects of synthetic data generation.
- Cloud dependencies risks – Many existing (commercial) APIs rely on cloud-based software, making them unsuitable for public organizations, as citizen data cannot simply be uploaded to cloud platforms. Local-first data processing offers a solution to this problem. With this tool, synthetic data can be generated directly in the browser. The data does not leave the user’s computer or the organization’s environment.
In sum, recent use cases have shown that synthetic data can be safely shared and generated without the involvement of a cloud provider. It is time to scale up so that stakeholders can gain more and better insights into the data managed by government organizations.
Applications
Lighthouse Reports was able to publicly share unintentionally obtained data using synthetic data, revealing bias in a dataset from the Municipality of Rotterdam. This dataset was used for machine learning-driven risk profiling in the context of social welfare re-examination.
AI Act
Additionally, Article 10(5) of the AI Act includes a specific provision regarding the use of synthetic data for bias detection and mitigation. It requires AI system providers to first investigate bias using synthetic or anonymized data, rather than directly processing “special categories of personal data.”
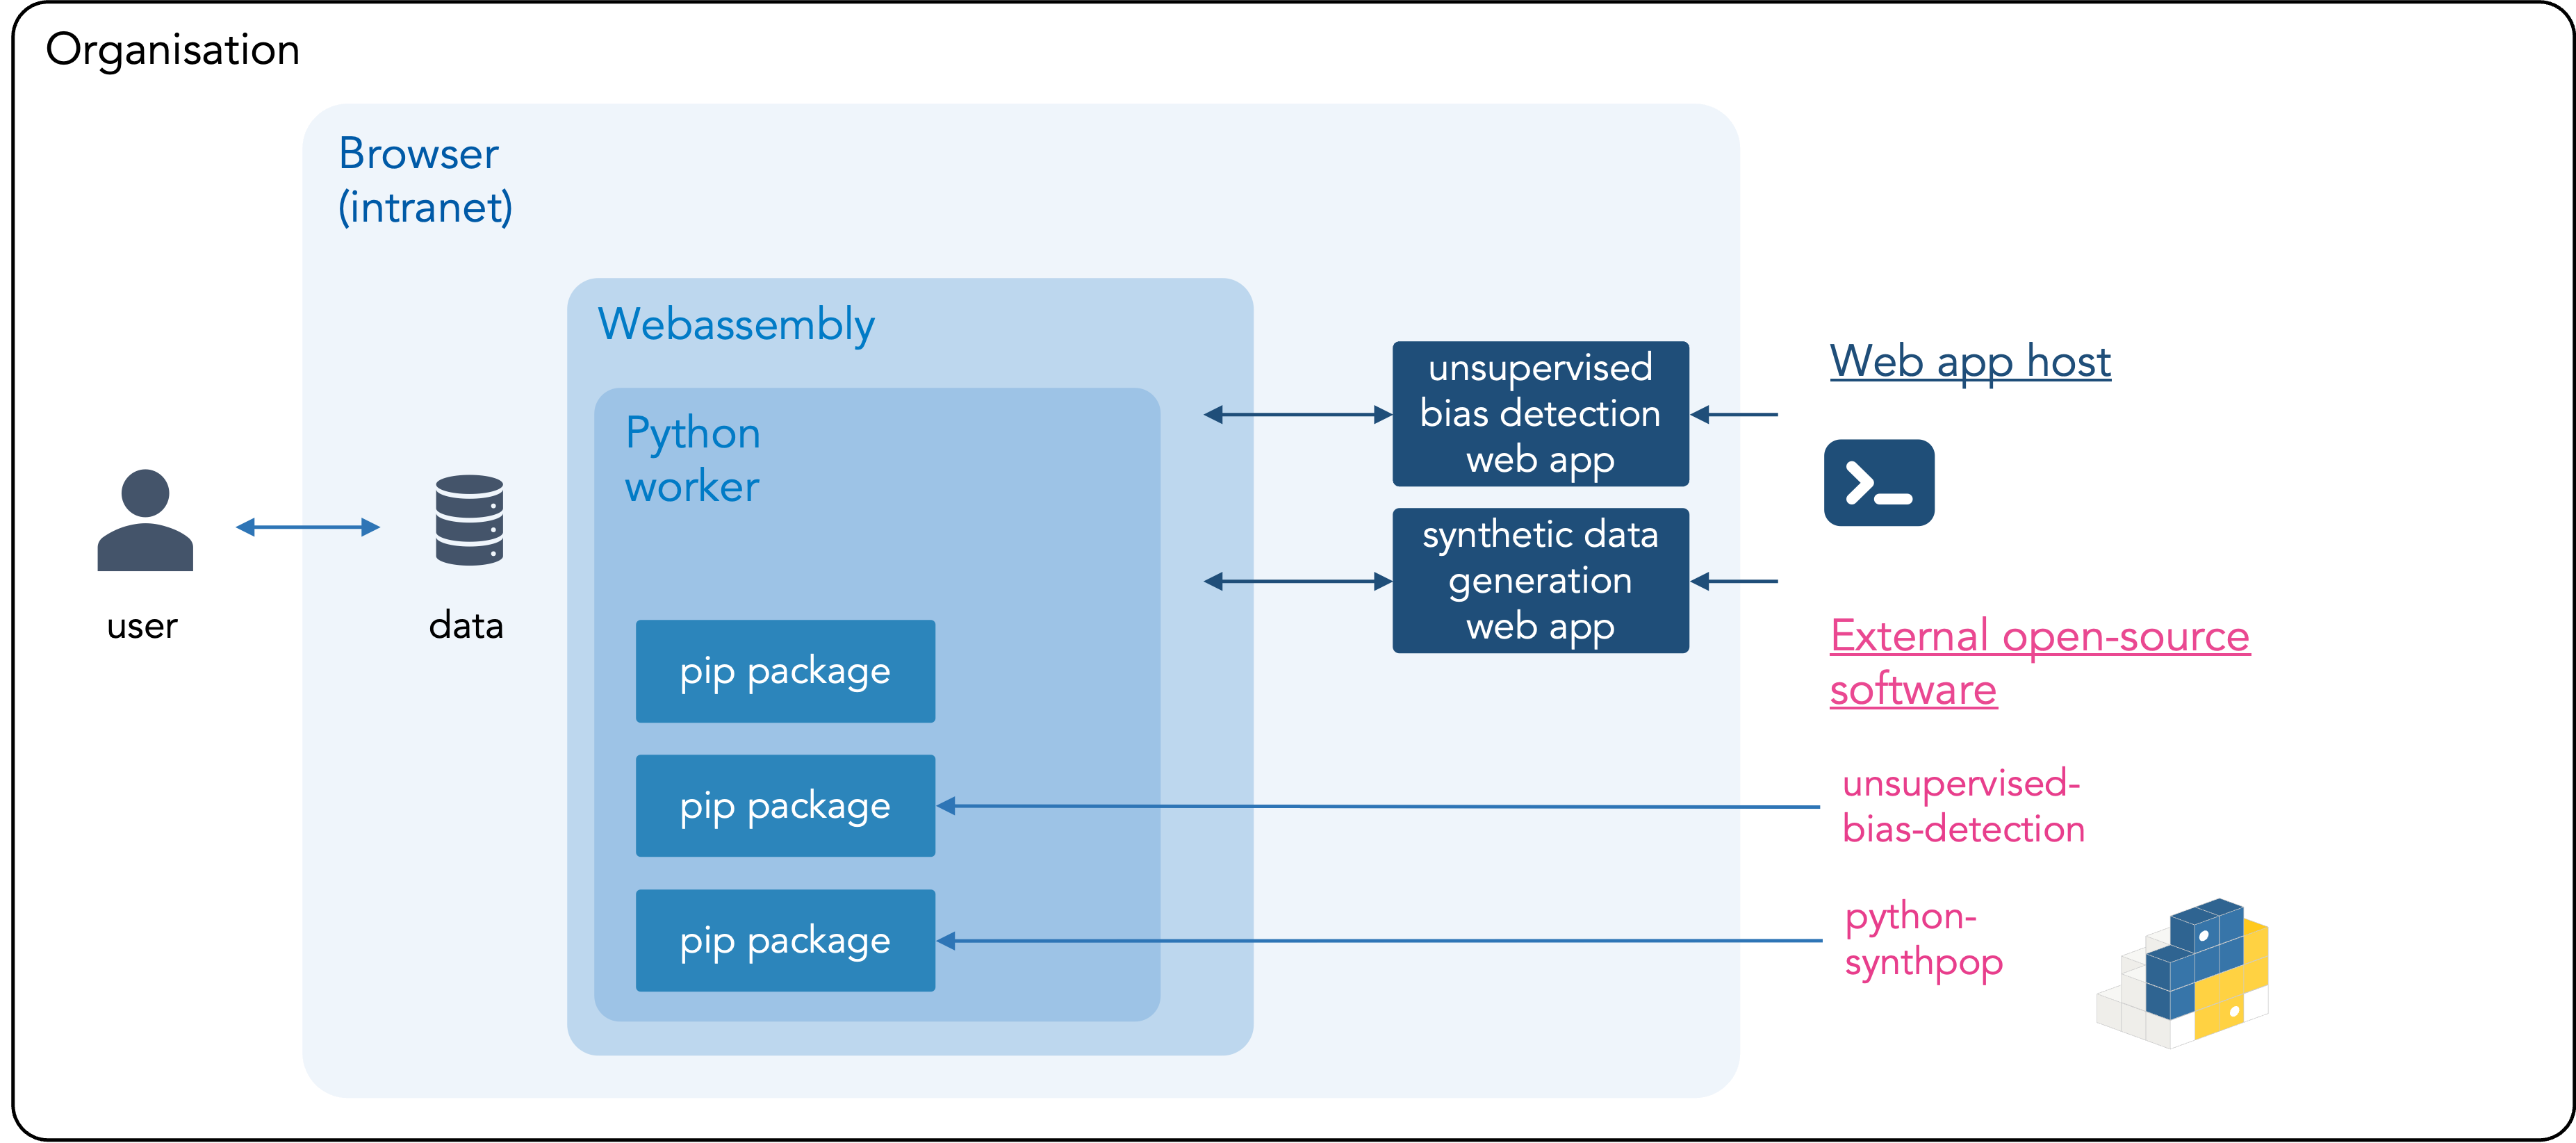
What is local-only?
Local-only computing is the opposite of cloud computing: data are not uploaded to third-parties, such as a cloud providers, but are processed by your own computer. The data attached to the tool therefore don’t leave your computer or the environment of your organization. The tool is privacy-friendly because the data can be processed within the mandate of your organisation and doesn’t need to be shared with new parties. The unsupervised bias detection tool can also be hosted locally within your organization. Instructions, including the source code or the web app, can be found on Github.
Overview of local-only architecture
Explainer – Local-only tools for AI validation
When auditing algorithmic-driven decision-making processes, one of the most immediate questions is the representativeness of the source data. However, privacy poses a hurdle to sharing data with external parties to assess the representativeness of the data. Absent access to source data means that stakeholders – such as people whose data is stored and independent experts – cannot scrutinize it for potential biases. Consequently, the evaluation of data used for decision-making processes, and training of AI-systems, relies on a small group of experts. If evaluation processes by this small group are not performed carefully, this can have severe downstream consequences, such as bias and skewed. This harms public trust in technology and in the organisations that deploy these digital methods.
Synthetic data generation (SDG) offers a promising solution. By creating data that mimics the properties of the original dataset without containing any identifiable personal information, SDG allows for broader participation in assessing data representativeness while preserving privacy. It is considered a safe approach for the wider release of privately held data, as it contains no identifiable trace of the personal data it was generated from.
This local-first synthetic data generation tool is developed with support of public and philanthropic organisations.

Innovation grant Dutch Ministry of the Interior
Description
In partnership with the Dutch Executive Agency for Education and the Dutch Ministry of the Interior, Algorithm Audit has been developing and testing this tool from July 2024 to July 2025, supported by an Innovation grant from the annual competition hosted by the Dutch Ministry of the Interior. Project progress was shared at a community gathering on 13-02-2025. A first version of the tools are launched during a webinar on 10-06-2025.


SIDN Fund
Description
In 2024, the SIDN Fund supported Algorithm Audit to develop a first demo of the synthetic data generation tool.